I plotted number of persons by wealth for each year of available data. (Click the image to enlarge.) To better relate the data to the growing size of the economy and population I plotted fraction of population instead of absolute numbers of persons and fraction of GDP instead of absolute dollar amounts. The units of wealth are millionths of GDP; in today's economy one millionth part of GDP is about $15,000,000.
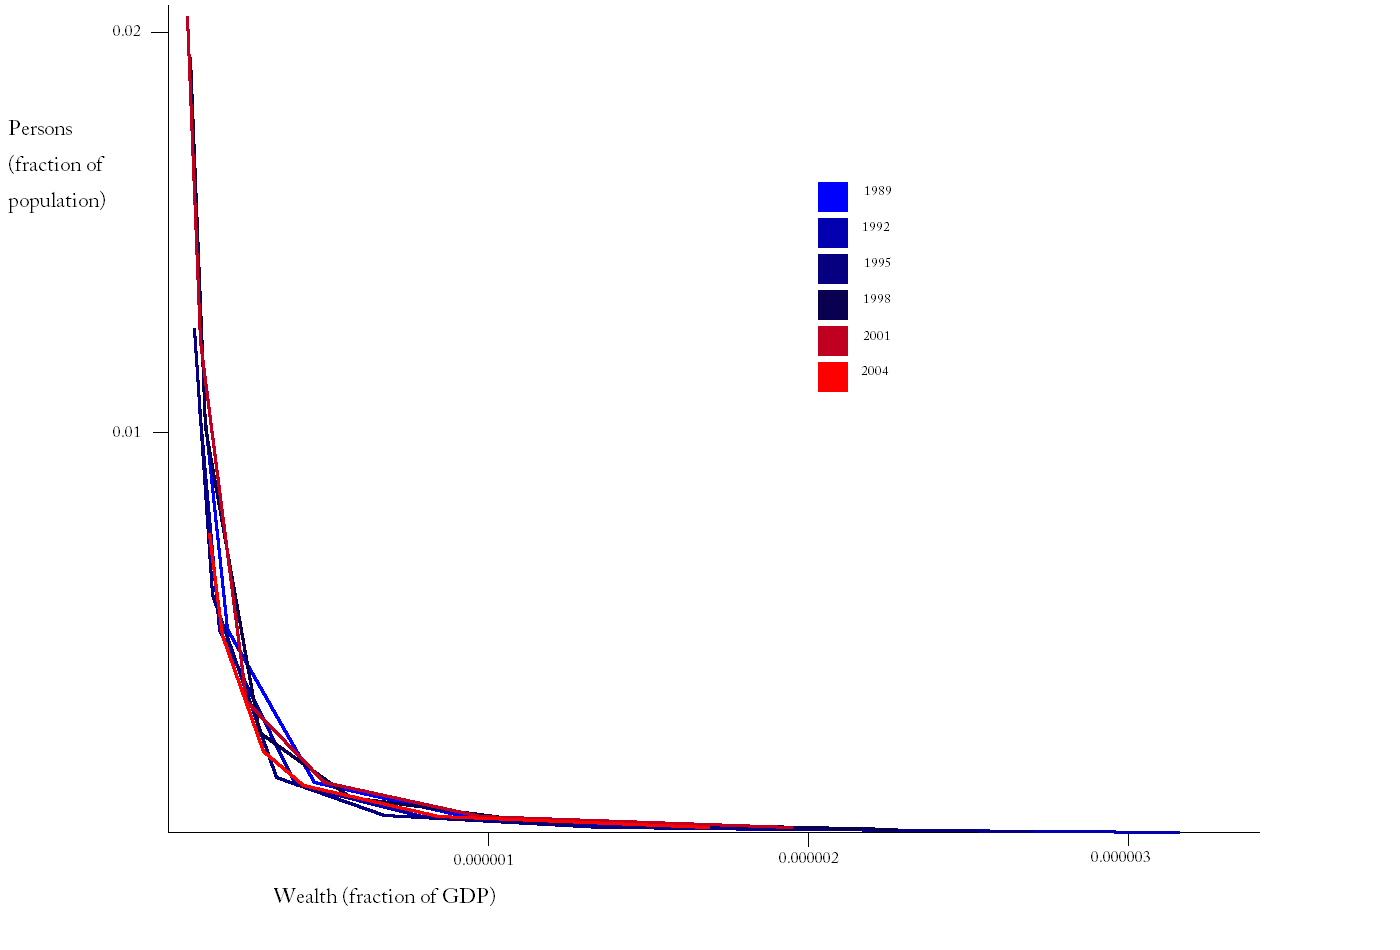
As can be seen in the graph above, wealth distribution didn't change all that much in the 15 year period. To get a closer look at the tail I stretched the y-axis. (See below.)

As can be seen above, by this measure, the distribution of wealth was actually less concentrated in 2004 than in 1989. If we define "wealthy" to mean someone who owns one millionth of GDP then about one of every 2000 people are wealthy and that fraction remained fairly constant over the period.
Another way to examine this question is to ask how much total wealth belongs to the wealthy. So instead of plotting the number of persons below I have plotted the aggregate wealth held by each "wealth class", that is, the total wealth held by all persons with wealth above a minimum wealth.

It appears that wealth concentration dropped after 1989 into the mid-1990s and then rose dramatically from the mid-1990s until 2001 before falling back in 2004, ending up moderately more concentrated than in 1989. It would be interesting to see how this correlates with stock prices over the period.
The raw data is available here.

No comments:
Post a Comment